Monday, 28 May 2018

Risk Tolerance

Before you step into the stock market, it is important to know that risk tolerance is a psychological trait that is genetically based. It is c risk tolerance appears to increase slightly. Risk tolerance is negatively influenced by age. For example, as one gets older, risk tolerance decreases. On the whole, in simple words, risk tolerance is how you feel about risk and the degree of anxiety you feel when risk is present. Technically, risk tolerance is defined as the extent to which a person can prefer to take a risk. Normally, all humans vary in their risk tolerance, and there is no right balance here.

You must also note that the risk tolerance is also affected by your perception of the risk. Consider an example that flying in an airplane or riding in a car would have been perceived as very risky in the early days, but less so today as flight and automobile travel are common occurrences. Therefore, many of us will feel today that riding a horse might be dangerous with a good chance of falling or being bucked off because few people are around horses. Thus, with this example, you will get to learn that the idea of perception is important, and especially when we are talking about investing.

When you learn more about investments that how stocks are bought and sold, how much volatility is usually present, and the difficulty or ease of liquidating an investment then you will think that stock investments are not at all risky. You thought that it is damn risky before making your first purchase but once you know everything about it, you feel no risk in it. Consequently, your nervousness is less intense, even though your risk tolerance remains unchanged as your awareness of the risk has changed.

In simple and plain concept, you can avoid those investments which are likely to make you anxious¸ by simply understanding your risk tolerance. Usually, you must never buy an asset that keeps you from sleeping in the night and makes you worried every time. It is believed that anxiety stimulates fear that triggers emotional responses rather than logical responses to the stressor. All such investors, who can be patient and follow an analytical decision process invariably comes out ahead, when there is the period of financial uncertainty.

Tuesday, 22 May 2018

Debt Ratios

A company’s debt ratio is the ratio of total debt to total assets. Total debt includes both short-term and long-term debt. There are several debt ratios, which give users a general idea of the company's overall debt load as well as its mix of equity and debt.

Debt ratios can be used to determine the overall level of financial risk a company and its shareholders face. In general, the greater the amount of debt held by a company, the greater the potential level of financial risk the company could face, including bankruptcy.

Debt is a form of financial leverage. The more levered a company is the greater the level of financial risk. On the other hand, a certain amount of leverage can contribute to a company’s growth. Well-run companies seek an optimal amount of financial leverage for their situation.

In the business world, debt is the amount that a business owes creditors. The most common forms of corporate debt are loans from banks and other lenders, as well as corporate or government bonds.

Debt is part of the liability section of a corporate balance sheet. Creditors have a claim on the company’s debt. Liabilities are obligations of the company, so failure to make good on these obligations could result in bankruptcy.

There are two types of liabilities — operational and debt. Operational includes balance sheet accounts, such as accounts payable, accrued expenses, taxes payable, pension obligations, etc. The latter includes notes payable and other short-term borrowings, the current portion of long-term borrowings, and long-term borrowings. In most investment literature, "debt" is used synonymously with total liabilities. In other instances, it only refers to a company's actual indebtedness.

The debt ratios that are explained in the following sections are those that are most commonly used. However, what companies, financial analysts and investment research services use as components to calculate these ratios is far from standardized.

Investors may want to look to the middle ground when deciding what to include in a company's debt position. With the exception of unfunded pension liabilities, a company's non-current operational liabilities represent obligations that will be around, at one level or another, forever—or at least until the company ceases to be a going concern and is liquidated.

Also, unlike external debt, there are no fixed payments or interest expenses associated with non-current operational liabilities. In other words, it is more meaningful for investors to view a company's indebtedness and obligations through the company as a going concern, and therefore, to use the moderate approach to defining debt in their leverage calculations.

(1) Debt Ratio:
The debt ratio compares a company's total debt to its total assets. This provides creditors and investors with a general idea as to the amount of leverage being used by a company. The lower the percentage, the less leverage a company is using and the stronger its equity position. In general, the higher the ratio, the more risk that company is considered to have taken on.

The debt ratio is calculated as follows:

Total Liabilities divided by Total Assets
If a company has $1 million in total liabilities and $3 million in total assets this means that for every dollar the company has in assets, it has 33 cents worth of liabilities.

If a company has $2 million in total liabilities compared to $3 million in total assets this means that for every dollar of assets the company has 67 cents worth of liabilities.

What does the debt ratio tell us?
The debt ratio tells us the degree of leverage used by the company.

If a company has a high debt ratio (the definition of high will vary by industry) this is an indication that the company must commit a significant portion of its ongoing cash flow to the payment of principal and interest on this debt.

On the other hand, a company that employs very little debt, especially if this is low compared to other companies in the same industry, may not be properly using leverage that might increase its level of profitability.

For example, utilities generally have a higher debt ratio than companies in many other industries due to the capital-intensive nature of the utility business.

Users of this data need to look beyond the ratio to determine what makes up the company’s liabilities. Items such as trade payables and goodwill might be excluded to provide a more accurate picture of the company’s long-term debt burden compared to their assets.

(2) Debt to Equity Ratio:
The debt-equity ratio is another leverage ratio that compares a company's total liabilities to its total shareholders' equity. This is a measurement of the percentage of the company’s balance sheet that is financed by suppliers, lenders, creditors and obligors versus what the shareholders have committed. 

The debt to equity ratio provides another vantage point on a company's leverage position, in that it compares total liabilities to shareholders' equity as opposed to total assets in the debt ratio. Similar to the debt ratio, a lower percentage means that a company is using less leverage and has a stronger equity position. 

The ratio is calculated by dividing the company’s total liabilities by its shareholder’s equity.

Like the debt ratio, this ratio is not a pure measurement of a company's debt because it includes operational liabilities as part of total liabilities.

Additionally, what constitutes a “good” or “bad” result will vary by industry. For example, an industry such as telecommunications and other types of utilities require substantial up-front and frequent ongoing capital investment.

These expenditures are often financed by borrowing so, all else being equal, their debt-equity ratio would be on the high side.

Utilities generally have a high level of debt because they can. Most electric utilities are virtual monopolies and have little or no competition. Unless the population in their service area were to rapidly decline, they can assume pretty stable revenues and cash flows, so they know with a high level of certainty how much they will have to service their debt on an ongoing basis.

The banking industry is another area with typically high levels of debt to equity. They use borrowed money to make loans at higher rates of interest than they are paying for the funds they borrow. This is one of the ways they make a profit.

The real use of debt-equity is in comparing the ratio for firms in the same industry. If a firm’s debt-equity ratio varies significantly from its competitors or the averages for its industry, this should raise a red flag. Companies with a ratio that is too high can be at risk for financial problems or even a default if they can’t meet their debt obligations.

On the other hand, companies employing too little leverage may be earning less than their competitors as a result.

(3) Capitalisation Ratio:
The capitalization ratio measures the debt component of a company's capital structure, defined as the mix of debt (liabilities) and shareholder’s equity on the company’s balance sheet. This is the means that the company uses to finance its operations and any capital spending.

Debt vs. Equity
Debt and equity are the two main methods a company can use to finance its operations.

Debt has some advantages. Interest payments are tax deductible. Debt also doesn’t dilute ownership of the firm like issuing additional stock does. When interest rates are low, access to the debt markets is easy and there is money available to lend.

Debt can be long-term or short-term and can consist of bank loans of the issuance of bonds.

Equity can be more expensive than debt. Raising additional capital by issuing more stock can dilute ownership in the company. On the other hand, equity doesn’t have to be paid back.

A company with too much debt may find its freedom of action restricted by its creditors and/or have its profitability hurt by high interest costs. The worst of all scenarios is having trouble meeting operating and debt liabilities on time during adverse economic conditions. Lastly, a company in a highly competitive business, if hobbled by high debt, will find its competitors taking advantage of its problems to grab more market share.

The capitalization ratio is one of the more meaningful debt ratios because it focuses on the relationship of debt liabilities as a component of a company's total capital base, which is the capital raised by shareholders and lenders.

(4) Interest Coverage Ratio:
The interest coverage ratio is used to determine how easily a company can pay their interest expenses on outstanding debt. The ratio is calculated by dividing a company's earnings before interest and taxes (EBIT) by the company's interest expenses for the same period. The lower the ratio, the more the company is burdened by debt expense. When a company's interest coverage ratio is only 1.5 or lower, its ability to meet interest expenses may be questionable.

The ratio measures how many times over a company could pay its outstanding debts using its earnings. This can be thought of as a margin of safety for the company’s creditors should the company run into financial difficulty down the road.

The ability to service its debt obligations is a key factor in determining a company’s solvency and is an important statistic for shareholders and prospective investors.

Investors want to be sure that a company they are considering investing in can pay its bills, including its interest expense. They don’t want the company’s growth derailed by these types of financial issues.

Creditors are concerned with the company’s ability to make their interest payments as well. If they are struggling to make the interest payments on their current debt obligations, it doesn’t make any sense for a prospective credit to extend them additional credit.

Trends over time
The interest coverage ratio at a point in time can help tell analysts a bit about the company’s ability to service its debt, but analyzing the interest coverage ratio over time will provide a clearer picture of whether or not their debt is becoming a burden on the company’s financial position. A declining interest coverage ratio is something for investors to be wary of, as it indicates that a company may be unable to pay its debts in the future. However, it is difficult to accurately predict a company’s long-term financial health with any ratio or metric.

Moreover, the desirability of any particular level of this ratio is in the eye of the beholder to an extent. Some banks or potential bond buyers may be comfortable with a less desirable ratio in exchange for charging the company a higher interest rate on their debt.

(5) Cash Flow to Debt Ratio:
This coverage ratio compares a company's operating cash flow to its total debt. Operating cash flow is defined as the amount of cash generated by the company’s normal business operations.

As an example, take a manufacturing company that reports a net income of $100 million, with an operating cash flow of $150 million. The difference comes from adding to the net income depreciation expense of $150 million, subtracting increases in accounts receivable of $50 million, adding decreases in inventory of $50 million and subtracting decreases in accounts payable of $100 million.

Depreciation is an expense for accrual accounting purposes, but there is no cash outlay so it is added back to reported net income. Increases in accounts receivables denote increased revenues but result in no actual cash inflows, hence they are subtracted. A decrease in inventories would indicate that less money had been spent adding to inventories, hence the increase in cash flow. An increase in inventories would have been a reduction in cash flow. The decrease in accounts payables means that the firm paid down some of its payables, which is a use or reduction of cash.

Debt is the sum of short-term borrowings, the current portion of long-term debt and long-term debt.

This ratio provides an indication of a company's ability to cover total debt with its yearly cash flow from operations. The higher the percentage ratio, the better the company's ability to carry and service its total debt.

Return on Capital Employed (ROCE)

The return on capital employed (ROCE) ratio, expressed as a percentage, complements the return on equity (ROE) ratio by adding a company's debt liabilities, or funded debt, to equity to reflect a company's total "capital employed". This measure narrows the focus to gain a better understanding of a company's ability to generate returns from its available capital base.

By comparing Earnings Before Interest and Tax (EBIT) or net operating profit to the sum of a company's debt and equity capital, investors can get a clear picture of how the use of leverage impacts a company's profitability. Financial analysts consider the ROCE measurement to be a more comprehensive profitability indicator because it gauges management's ability to generate earnings from a company's total pool of capital.

Formula:


Variations:
There are various takes on what should constitute the debt element in the ROCE equation, which can be quite confusing. My suggestion is to stick with debt liabilities that represent interest-bearing, documented credit obligations (short-term borrowings, current portion of long-term debt, and long-term debt) as the debt capital in the formula.

Commentary:
The return on capital employed is an important measure of a company's profitability. Many investment analysts think that factoring debt into a company's total capital provides a more comprehensive evaluation of how well management is using the debt and equity it has at its disposal. Investors would be well served by focusing on ROCE as a key, if not the key, factor to gauge a company's profitability. An ROCE ratio, as a very general rule of thumb, should be at or above a company's average borrowing rate.
Unfortunately, there are a number of similar ratios to ROCE, as defined herein, that are similar in nature but calculated differently, resulting in dissimilar results. First, the acronym ROCE is sometimes used to identify Return On Common Equity, which can be confusing because that relationship is best known as the return on equity or ROE. Second, the concept behind the terms return on invested capital (ROIC) and return on investment (ROI) portends to represent "invested capital" as the source for supporting a company's assets. However, there is no consistency to what components are included in the formula for invested capital, and it is a measurement that is not commonly used in investment research reporting.

Return on Equity (ROE)

Warren Buffett has reportedly said that Return on Equity (ROE) is his favorite metric. That doesn’t mean it has to be your favorite metric, but ROE sees widespread use for good reason. Any serious student of fundamental analysis needs to know this metric and its limitations.
Mathematically, ROE is simple:
ROE is a true bottom-line profitability metric, comparing the profit available to shareholders to the capital provided or owned by shareholders. In a conceptual sense, it’s the profitability measure that equity investors care most about. Whereas return on assets (see the prior article by me) and return on invested capital each depict a variant of profitability available to both debt and equity investors, ROE stays pure, comparing the income available to just equity investors to the capital owned (and put to work) by just equity investors.

ROE: P/E’s Brother From Another Mother

If you’ve heard of the price-to-earnings (P/E) ratio, you’ve seen ROE’s half-brother.

P/E, as we know, divides stock price by net income per share. For example, a Rs100 stock with Rs10 in net income per share last year would have a P/E of 10. We can compute P/E on an aggregate level, too: A company with a Rs100 million market capitalization and Rs10 million in net income would also have a P/E of 10.
If we flip P/E, we get E/P, or earnings yield. For instance, divide Rs10 million in net income by Rs100 million in market cap and you get a 10% earnings yield.
Now, just replace the market value of equity with the book value and you’ve got ROE. A market value of equity denominator shows how much a company earns per the value the market assigns it (a valuation concept), whereas a book value denominator shows earnings relative to the internal equity it had to work with (arguably closer to an operational profitability concept).

ROE: Betrayed by Book Value

Warren Buffett traditionally defined success for Berkshire Hathaway as an increasing book value of equity. It’s natural, if not axiomatic, that anyone who loves ROE trusts book value of equity. But there are many reasons not to trust book value of equity. Book value is reliable for banks, and sometimes for old-school “hard asset”-type companies, but if the goal is an accurate measure of operational returns, it can be problematic as the denominator for ROE in many situations, especially with modern business models and corporate practices.
 We discuss some of those situations below. Note that for best comparison, adjustments need to be equally applied across the full comparison set, whether a company’s own prior financial history, competitors’, or both.

Factors that could skew book value of shareholders’ equity high (and thus ROE low)
Common adjustments (or notes)
High cash balanceRemove cash from shareholders’ equity value and, ideally, remove interest income from net income, adjusting for tax effects.
GoodwillRemove goodwill, or at least goodwill deemed excessive, from shareholders’ equity. Not all analysts would make this adjustment; their logic is that excessive payment for acquisitions is a company’s “own stupid fault” and that a company should fairly be expected to earn a return on what it bought.
Factors that could skew book value of shareholders’ equity low (and thus ROE high)
Common adjustments (or notes)
BuybacksBecause buybacks reduce shareholders’ equity, some analysts add back recent-year buybacks to offset.
Write-downsWrite-downs are usually done for good reason (and usually not often enough), so many analysts would consider them explanatory factors to be aware of more than accounting quirks to be undone.
Profit after a long period of lossesCumulative profits, at least those not paid as dividends, boost equity as “retained earnings” on the balance sheet. Cumulative losses do the opposite: they lower book value. As with write-downs, meaningful negative retained earnings shouldn’t be reversed simply to get a more normal-looking ROE, but analysts should note they make the metric relatively less relevant.
Research & Development (R&D) costsSince 1975, US companies have been required to expense, rather than capitalize, R&D costs. Capitalizing R&D goes beyond the scope of this article, but basically entails adding a multiple or partial sum of prior-years’ R&D expenses to shareholders’ equity (capitalizing means putting something onto the balance sheet) while swapping actual R&D expense for an amortized accrual version (based on expected life of the R&D asset) on the income statement.

In terms of keeping the spirit of ROE, the net income and dividends are fine. There’s some accounting theory debate about which foreign currency costs should be on the income statement (i.e., affecting net profit) and which should get “buried” in other comprehensive income, or OCI (which, despite its name, is a balance sheet account), but we’ll sidestep that debate for now, especially because foreign currency adjustments tend to ebb and flow over the years. This leaves one real culprit: buybacks.
A buyback double-teams the ROE denominator by reducing cash and increasing treasury stock (a “contra” account on the balance sheet that reduces book equity) in a single whammy. In fact, the companies whose ROEs are most skewed by buybacks are almost invariably among the highest-regarded; they’re the companies that have earned enough cash over the decades to bankroll big share repurchases. Just know that ROE will overstate the here-and-now profitability of the equity capital at work for these companies.

ROE’s Silent Influencer: Debt

In a usage sense, rather than a computational one, the biggest weakness of ROE is that it ignores debt. Yes, that’s also its biggest strength, as we mentioned earlier. See, debt can be friend or foe. Higher debt will, if things go well, increase a company’s resource base and thereby its profits. Because debt financing is usually cheaper than equity financing, companies can enhance returns to shareholders by taking on debt in a sensible proportion (ranging from very high for a safe utility to nothing for a risky biotech). The problem with ROE is that it can’t differentiate between profitability boosts fueled purely by operational gains and those fueled by added leverage.

The Best Is Yet to Come

While ROE is the most directly relevant profitability metric for equity investors, many analysts contend that measuring profitability on an equity level has a few too many quirks and warts to be ideal. Their choice for measuring overall company profit? Return on Invested Capital, which we’ll discuss in the next section.

Sunday, 13 May 2018

Cash Flow Statement

The Cash flow statement is a very important financial statement, as it reveals how much cash the company is actually generating. Is this information not revealed in the P&L statement you may think? Well, the answer is both a yes and a no.

Consider the following scenario.
Assume a simple coffee shop selling coffee and short eats. All the sales the shop does is mostly on cash basis, meaning if a customer wants to have a cup of coffee and a snack, he needs to have enough money to buy what he wants. Going by that on a particular day, assume the shop manages to sell Rs.2,500/- worth of coffee and Rs.3,000/- worth of snacks. It is evident that the shop’s income is Rs.5,500/- for that day. Rs.5,500/- is reported as revenues in P&L, and there is no ambiguity with this.
Now think about another business that sells laptops. For sake of simplicity, let us assume that the shop sells only 1 type of laptop at a standard fixed rate of Rs.25,000/- per laptop. Assume on a certain day, the shop manages to sells 20 such laptops. Clearly the revenue for the shop would be Rs.25,000 x 20 = Rs.500,000/-. But what if 5 of the 20 laptops were sold on credit? A credit sale is when the customer takes the product today but pays the cash at a later point in time. In this situation here is how the numbers would look:
Cash sale: 15 * 25000 = Rs.375,000/-
Credit sale: 5 * 25000 = Rs.125,000/-
Total sales: Rs.500,000/-
If this shop was to show its total revenue in its P&L statement, you would just see a revenue of Rs.500,000/- which may seem good on the face of it. However, how much of this Rs.500,000/- is actually present in the company’s bank account is not clear. What if this company had a loan of Rs.400,000/- that had to be repaid back urgently? Even though the company has a sale of Rs.500,000 it has only Rs.375,000/- in its account. This means the company has a cash crunch, as it cannot meet its debt obligations.
The cash flow statement captures this information. A statement of cash flows should be presented as an integral part of an entity’s financial statements. Hence in this context evaluation of the cash flow statement is highly critical as it reveals amongst other things, the true cash position of the company.
To sum up, every company’s financial performance is not so much dependent on the profits earned during a period, but more realistically on liquidity or cash flows.

Activities of a company

Before we go ahead to understand the cash flow statement, it is important to understand ‘the activities’ of a company. If you think about a company and the various business activities it undertakes, you will realize that the company’s activities can be classified under one of the three standard baskets. We will understand this in terms of an example.
Imagine a business, maybe a very well established fitness center (Talwalkars, Gold’s Gym etc) with a sound corporate structure. What are the typical business activities you think a fitness center would have? Let me go ahead and list a few business activities:
  1. Display advertisements to attract new customers
  2. Hire fitness instructors to help clients in their fitness workout
  3. Buy new fitness equipments to replace worn out equipments
  4. Seek short term loan from bankers
  5. Issue a certificate of deposit for raising funds
  6. Issue new shares to a few known friends to raise fresh capital for expansion (also called preferential allotment)
  7. Invest in a startup company working towards innovative fitness regimes
  8. Park excess money (if any) in fixed deposits
  9. Invest in a building coming up in the neighborhood, for opening a new fitness center sometime in the future
  10. Upgrade the sound system for a better workout experience
As you can see the above listed business activities are quite diverse however they are all related to the business. We can classify these activities as:
  1. Operational activities (OA): Activities that are directly related to the daily core business operations are called operational activities. Typical operating activities include sales, marketing, manufacturing, technology upgrade, resource hiring etc.
  2. Investing activities (IA): Activities pertaining to investments that the company makes with an intention of reaping benefits at a later stage. Examples include parking money in interest bearing instruments, investing in equity shares, investing in land, property, plant and equipment, intangibles and other non current assets etc
  3. Financing activities (FA): Activities pertaining to all financial transactions of the company such as distributing dividends, paying interest to service debt, raising fresh debt, issuing corporate bonds etc
All activities a legitimate company performs can be classified under one of the above three mentioned categories.
Keeping the above three activities in perspective, we will now classify each of the above mentioned activities into one of the three categories /baskets.
  1. Display advertisements to attract new customers – OA
  2. Hire fitness instructors to help customers with their fitness workout – OA
  3. Buy new fitness equipment to replace worn out equipments – OA
  4. Seek a short term loan from bankers – FA
  5. Issue a certificate of deposit (CD) for raising funds – FA
  6. Issue new shares to few known friends to raise fresh capital for expansion (also called preferential allotment) – FA
  7. Invest in a startup company working towards innovative fitness regimes – IA
  8. Park excess money (if any) in fixed deposit – IA
  9. Invest in a building coming up in the neighborhood for opening a new fitness center sometime in the future – IA
  10. Upgrade the sound system for better workout experience- OA
Now think about the cash moving in and out of the company and its impact on the cash balance. Each activity that the company undertakes has an impact on cash. For example “Upgrade the sound system for a better workout experience” means the company has to pay money towards the purchase of a new sound system, hence the cash balance decreases. Also, it is interesting to note that the new sound system itself will be treated as a company asset.
Keeping this in perspective, we will now understand for the example given above how the various activities listed would impact the cash balance and how would it impact the balance sheet.


The table above is colour coded:
  1. Increase in cash is colour coded in blue
  2. Decrease in cash is colour coded in red
  3. Assets are colour coded in green and
  4. Liabilities are colour coded in purple.
If you look through the table and start correlating the ‘Cash Balance’ and ‘Asset/Liability’ you will observe that:
  1. Whenever the liabilities of the company increases the cash balance also increases
    1. This means if the liabilities decreases, the cash balance also decreases
  2. Whenever the asset of the company increases, the cash balance decreases
    1. This means if the assets decreases, the cash balance increases
The above conclusion is the key concept while constructing a cash flow statement. Also, extending this further you will realize that each activity of the company be it operating activity, financing activity, or investing activity either produces cash  (net increase in cash) or reduces (net decrease in cash)the cash for the company.
Hence the total cash flow for the company will be:-
Cash Flow of the company = Net cash flow from operating activities + Net Cash flow from investing activities + Net cash flow from financing activities
The Cash Flow Statement


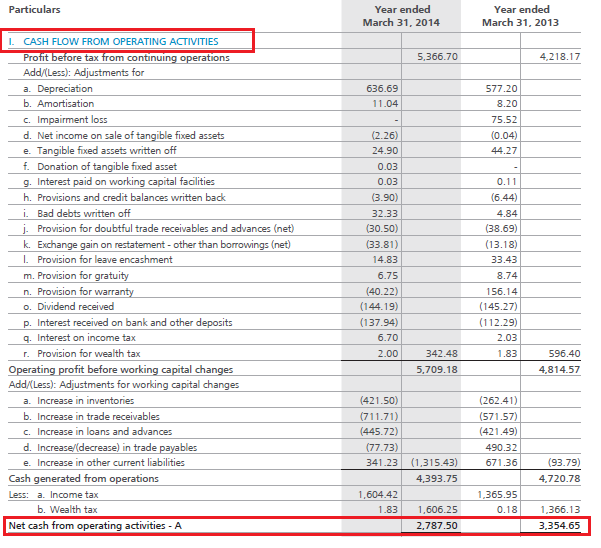
This means the company consumed a total cash of Rs.119.19 Crs for the financial year 2013 -2014. Fair enough, but what about the cash from the previous year? As we can see, the company generated Rs.179.986 Crs through all its activities from the previous year. Here is an extract from ARBL’s cash flow statement:

Having some insight into the cash flow statement, you would now appreciate the fact that you need to look into the cash flow statement to review the company from a cash perspective.
Typically when companies present their cash flow statement they split the statement into three segments to explicitly show how much cash the company has generated across the three business activities. Continuing with our example from the earlier chapters, here is the cash flow statement of Amara Raja Batteries Limited (ARBL):
M3-Ch8-Chart1
I will skip going through each line item as most of them are self explanatory, however I want you to notice that ARBL has generated Rs.278.7 Crs from operating activities. Note, a company which has a positive cash flow from operating activities is always a sign of financial well being.
Here is the snapshot of ARBL’s cash flow from investing activities:
M3-Ch8-Chart2
As you can see, ARBL has consumed Rs.344.8 Crs in its investing activities. This is quite intuitive as investing activities tend to consume cash. Also remember healthy investing activities foretells the investor that the company is serious about its business expansion. Of course how much is considered healthy and how much is not, is something we will understand as we proceed through this module.
Finally, here is the snapshot of ARBL’s cash balance from financing activities:
M3-Ch8-Chart3
ARBL consumed Rs.53.1Crs through its financing activities. If you notice the bulk of the money went in paying dividends. Also, if ARBL takes on new debt in future it would lead to an increase in the cash balance (remember increase in liabilities, increases cash balance). We know from the balance sheet that ARBL did not undertake any new debt.
Let us summarize the cash flow from all the activities:

M3-Ch8-Chart4
Look at the section highlighted in green (for the year 2013-14). It says the opening balance for the year is Rs.409.46Crs. How did they get this? Well, this happens to be the closing balance for the previous year (refer to the arrow marks). Add to this the current year’s cash equivalents which is (Rs.119.19) Crs along with a minor forex exchange difference of Rs.2.58 Crs we get the total cash position of the company which is Rs.292.86 Crs. This means, while the company guzzled cash on a yearly basis, they still have adequate cash, thanks to the carry forward from the previous year.
Note, the closing balance of 2013-14 will now be the opening balance for the FY 2014 – 15. You can watch out for this when ARBL provides its cash flow numbers for the year ended 31st March 2015.
At this point, let us run through a few interesting questions and answers:
  1. What does Rs.292.86 Crs actually state?
    1. This literally shows how much cash ARBL has in its various bank accounts
  2. What is cash?
    1. Cash comprises cash on hand and demand deposits. Obviously, this is a liquid asset of the company
  3. What are liquid assets?
    1. Liquid assets are assets that can be easily converted to cash or cash equivalents
  4. Are liquid assets similar to ‘current items’ that we looked at in the Balance sheet?
    1. Yes, you can think of it that way
  5. If cash is current and cash is an asset, shouldn’t it reflect under the current asset on the Balance sheet?
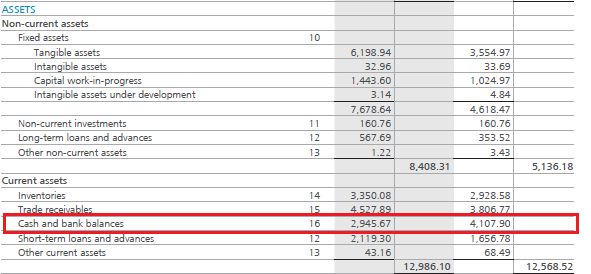
    1. Exactly and here it is. Look at the balance sheet extract below.
M3-Ch8-Chart5
Clearly, we can now infer that the cash flow statement and the balance sheet interact with each other. This is in line with what we had discussed earlier i.e all the three financial statements are interconnected with each other.

A brief on the financial statements

Over the last few chapters we have discussed the three important financial statements of the company i.e the P&L statement, the Balance Sheet and the Cash Flow statement of the company. While the Cash flow and P&L statement are prepared on a standalone basis (representing the financial position for the given year), the Balance Sheet is prepared on a flow basis.
The P&L statement discusses how much the company earned as revenues versus how much the company expended in terms of expenses. The retained earnings of the company also called the surplus of the company are carried forward to the balance sheet. The P&L also incorporates the depreciation number. The depreciation mentioned in the P&L statement is carried forward to the balance sheet.
The Balance Sheet details the company’s assets and liabilities. On the liabilities side of the Balance sheet the company represents the shareholders’ funds. The assets should always be equal to the liabilities, only then do we say the balance sheet has balanced. One of the key details on the balance sheet is the cash and cash equivalents of the firm. This number tells us,   how much money the company has in its bank account. This number comes from the cash flow statement.
The cash flow statement provides information to the users of the financial statements about the entity’s ability to generate cash and cash equivalents as well as indicates the cash needs of a company. The statement of cash flows are prepared on a historical basis providing information about the cash and cash equivalents, classifying cash flows in to operating, financing and investing activities. The final number of the cash flow tells us how much money the company has in its bank account.

Buying stock with high P/E ratio?


Saturday, 12 May 2018

Balance Sheet Deeply Decoded

The balance sheet equation

While the P&L statement gives us information pertaining to the profitability of the company, the balance sheet gives us information pertaining to the assets, liabilities, and the shareholders equity. The P&L statement as you understood, discusses about the profitability for the financial year under consideration, hence it is good to say that the P&L statement is a standalone statement. The balance sheet however is prepared on a flow basis, meaning, it has financial information pertaining to the company right from the time it was incorporated. Thus while the P&L talks about how the company performed in a particular financial year; the balance sheet on the other hand discusses how the company has evolved financially over the years.
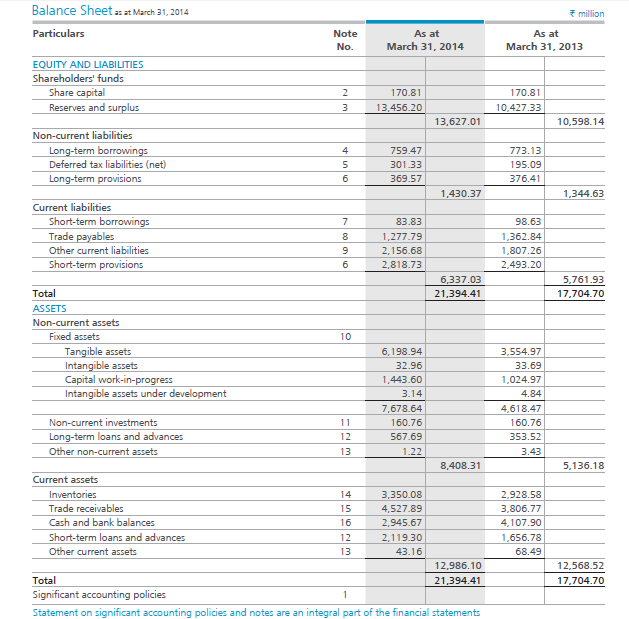
Have a look at the balance sheet of Amara Raja Batteries Limited (ARBL):
M3-Ch6-Chart1
As you can see the balance sheet contains details about the assets, liabilities, and equity.
We had discussed about assets in the previous chapter. Assets, both tangible and intangible are owned by the company. An asset is a resource controlled by the company, and is expected to have an economic value in the future. Typical examples of assets include plants, machinery, cash, brands, patents etc. Assets are of two types, current and non-current, we will discuss these later in the chapter.
Liability on the other hand represents the company’s obligation. The obligation is taken up by the company because the company believes these obligations will provide economic value in the long run. Liability in simple words is the loan that the company has taken and it is therefore obligated to repay back.  Typical examples of obligation include short term borrowing, long term borrowing, payments due etc. Liabilities are of two types namely current and non-current. We will discuss about the kinds of liabilities later on in the chapter.
In any typical balance sheet, the total assets of company should be equal to the total liabilities of the company. Hence,
Assets = Liabilities
The equation above is called the balance sheet equation or the accounting equation. In fact this equation depicts the key property of the balance sheet i.e the balance sheet should always be balanced. In other word the Assets of the company should be equal to the Liabilities of the company. This is because everything that a company owns (Assets) has to be purchased either from either the owner’s capital or liabilities.
Owners Capital is the difference between the Assets and Liabilities. It is also called the ‘Shareholders Equity’ or the ‘Net worth’. Representing this in the form of an equation :
Share holders equity = Assets – Liabilities

A quick note on shareholders’ funds

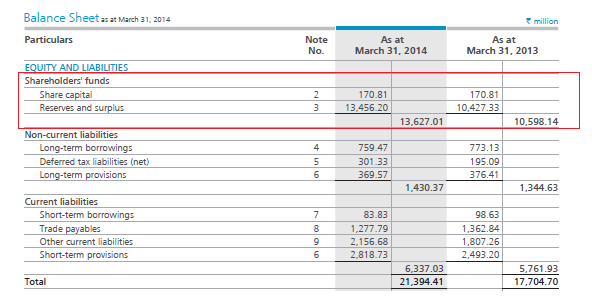
As we know the balance sheet has two main sections i.e. the assets and the liabilities. The liabilities as you know represent the obligation of the company. The shareholders’ fund, which is integral to the liabilities side of the balance sheet, is highlighted in the snapshot below. Many people find this term a little confusing.
M3-Ch6-Chart2
If you think about it, on one hand we are discussing about liabilities which represent the obligation of the company, and on the other hand we are discussing the shareholders’ fund which represents the shareholders’ wealth. This is quite counter intuitive isn’t it? How can liabilities and shareholders’ funds appear on the ‘Liabilities’ side of balance sheet? After all the shareholders funds represents the funds belonging to its shareholders’ which in the true sense is an asset and not really a liability.
To make sense of this, you should change the perceptive in which you look at a company’s financial statement. Think about the entire company as an individual, whose sole job is run its core operation and to create wealth to its shareholders’. By thinking this way, you are in fact separating out the shareholders’ (which also includes its promoters) and the company. With this new perspective, now think about the financial statement. You will appreciate that, the financial statements is a statement published by the company (which is an entity on its own) to communicate to the world about its financial well being.
This also means the shareholders’ funds do not belong to the company as it rightfully belongs to the company’s shareholders’. Hence from the company’s perspective the shareholders’ funds are an obligation payable to shareholders’. Hence this is shown on the liabilities side of the balance sheet.

The liability side of balance sheet

The liabilities side of the balance sheet details out all the liabilities of the company. Within liabilities there are three sub sections – shareholders’ fund, non-current liabilities, and current liabilities. The first section is the shareholders’ funds.
M3-Ch6-Chart3
To understand share capital, think about a fictional company issuing shares for the first time. Imagine, Company ABC issues 1000 shares, with each share having a face value of Rs.10 each. The share capital in this case would be Rs.10 x 1000 = Rs.10,000/- (Face value X number of shares).
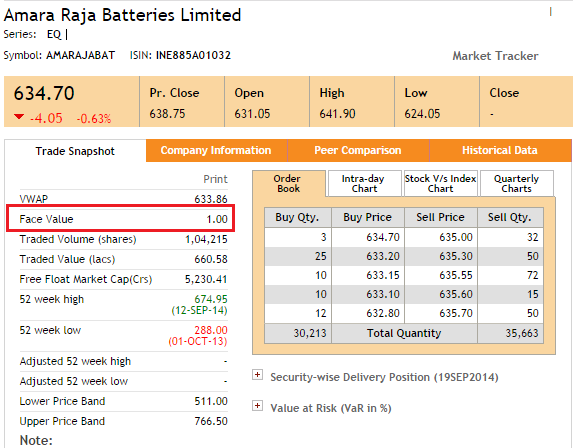
In the case of ARBL, the share capital is Rs.17.081 Crs (as published in the Balance Sheet) and the Face Value is Rs.1/-. I got the FV value from the NSE’s website:
M3-Ch6-Chart4
I can use the FV and share capital value to calculate the number of shares outstanding. We know:
Share Capital = FV * Number of shares
Therefore,
Number of shares = Share Capital / FV
Hence in case of ARBL,
Number of shares = 17,08,10,000 / 1
= 17,08,10,000 shares
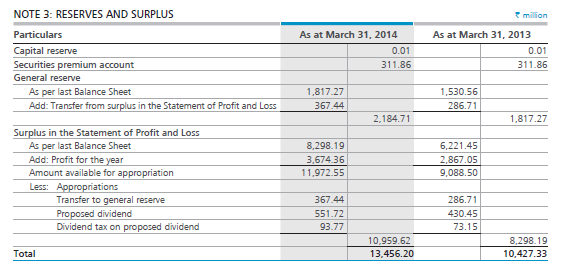
The next line item on the liability side of the Balance Sheet is the ‘Reserves and Surplus’. Reserves are usually money earmarked by the company for specific purposes. Surplus is where all the profits of the company reside. The reserves and surplus for ARBL stands at Rs.1,345.6 Crs. The reserves and surplus have an associated note, numbered 3. Let us look into the same.
M3-Ch6-Chart5
As you can notice from the note, the company has earmarked funds across three kinds of reserves:
  1. Capital reserves – Usually earmarked for long term projects. Clearly ARBL does not have much amount here. This amount belongs to the shareholders, but cannot be distributed to them.
  2. Securities premium reserve / account – This is where the premium over and above the face/par value of the shares sits. ARBL has a Rs.31.18 Crs under this reserve
  3. General reserve – This is where all the accumulated profits of the company which is not yet distributed to the shareholder reside. The company can use the money here as a buffer. As you can see ARBL has Rs.218.4 Crs in general reserves.
The next section deals with the surplus. As mentioned earlier, surplus holds the profits made during the year. Couple of interesting things to note:
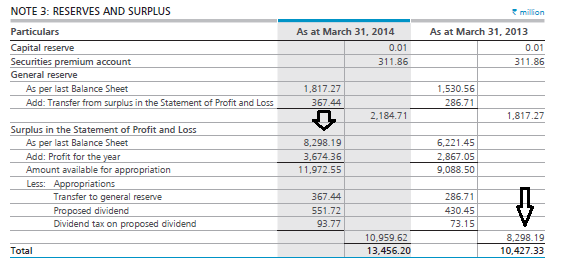
    1. As per the last year (FY13) balance sheet the surplus was Rs.829.8Crs. This is what is stated as the opening line under surplus. See the image below:
M3-Ch6-Chart6
  1. The current year (FY14) profit of Rs.367.4 Crs is added to previous years closing balance of surplus. Few things to take note here:
    1. Notice how the bottom line of P&L is interacting with the balance sheet. This highlights a very important fact – all the three financial statements are closely related
    2. Notice how the previous year balance sheet number is added up to this year’s number. This highlights the fact that the balance sheet is prepared on a flow basis, adding the carrying forward numbers year on year
  2. Previous year’s balance plus this year’s profit adds up to Rs.1197.2 Crs. The company can choose to apportion this money for various purposes.
    1. The first thing a company does is it transfers some money from the surplus to general reserves so that it will come handy for future use. They have transferred close to Rs.36.7 Crs for this purpose
    2. After transferring to general reserves they have distributed Rs.55.1 Crs as dividends over which they have to pay Rs.9.3 Crs as dividend distribution taxes.
  3. After making the necessary apportions the company has Rs.1095.9 Crs as surplus as closing balance. This as you may have guessed will be the opening balance for next year’s (FY15) surplus account.
  4. Total Reserves and Surplus = Capital reserve + securities premium reserve + general reserves + surplus for the year. This stands at Rs.1345.6 Crs for the FY 14 against Rs.1042.7 Crs for the FY13
The total shareholders’ fund is a sum of share capital and reserves & surplus. Since this amount on the liability side of the balance sheet represents the money belonging to shareholders’, this is called the ‘shareholders funds’.

Non Current Liabilities

Non-current liabilities represent the long term obligations, which the company intends to settle/ pay off not within 365 days/ 12 months of the balance sheet date. These obligations stay on the books for few years. Non-current liabilities are generally settled after 12 months after the reporting period.
Here is the snapshot of the non-current liabilities of Amara Raja batteries Ltd.
M3-Ch6-Chart7
The company has three types of non-current liabilities; let us inspect each one of them.
The long term borrowing (associated with note 4) is the first line item within the non-current liabilities. Long term borrowing is one of the most important line item in the entire balance sheet as it represents the amount of money that the company has borrowed through various sources. Long term borrowing is also one of the key inputs while calculating some of the financial ratios. Subsequently in this module we will look into the financial ratios.
Let us look into the note associated with ‘Long term borrowings’:
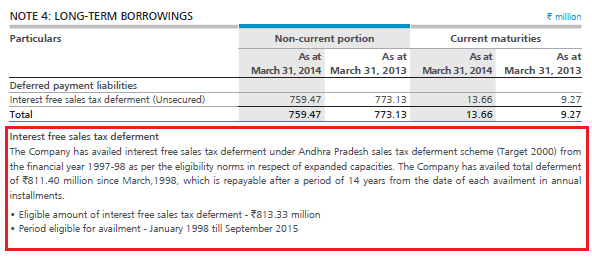
M3-Ch6-Chart8
From the note it is quite clear that the ‘Long term borrowings’ is in the form of ‘interest free sales tax deferment’. To understand what interest free sales tax deferment really means, the company has explained just below the note (I have highlighted the same in a red box). It appears to be some sort of tax incentive from the state government. The company plans to settle this amount over a period of 14 years.
You will find that there are many companies which do not have long term borrowings (debt). While it is a good to know that the company has no debt, you must also question as to why there is no debt? Is it because the banks are refusing to lend to the company? or is it because the company is not taking initiatives to expand their business operations. Of course, we will deal with the analysis part of the balance sheet later in the module.
Do recollect, we looked at ‘Finance Cost’ as a line item when we looked at the P&L statement. If the debt of the company is high, then the finance cost will also be high.
The next line item within the non-current liability is ‘Deferred Tax Liability’. The deferred tax liability is basically a provision for future tax payments. The company foresees a situation where it may have to pay additional taxes in the future; hence they set aside some funds for this purpose. Why do you think the company would put itself in a situation where it has to pay more taxes for the current year at some point in the future?
Well this happens because of the difference in the way depreciation is treated as per Company’s act and Income tax. We will not get into this aspect as we will digress from our objective of becoming users of financial statements. But do remember, deferred tax liability arises due to the treatment of depreciation.
The last line item within the non-current liability is the ‘Long term provisions’. Long term provisions are usually money set aside for employee benefits such as gratuity; leave encashment, provident funds etc.

Current liabilities

Current liabilities are a company’s obligations which are expected to be settled within 365 days (less than 1 year). The term ‘Current’ is used to indicate that the obligation is going to be settled soon, within a year. Going by that ‘non-current’ clearly means obligations that extend beyond 365 days.
Think about this way – if you buy a mobile phone on EMI (via a credit card) you obviously plan to repay your credit card company within a few months. This becomes your ‘current liability’. However if you buy an apartment by seeking a 15 year home loan from a housing finance company, it becomes your ‘non-current liability’.
Here is the snapshot of ARBL’s current liabilities:
M3-Ch6-Chart9
As you can see there are 4 line items within the current liabilities. The first one is the short term borrowings. As the name suggests, these are short term obligations of the company usually undertaken by the company to meet day to day cash requirements (also called working capital requirements). Here is the extract of note 7, which details what short term borrowings mean:
M3-Ch6-Chart10
Clearly as you can see, these are short term loans availed from the State bank of India and Andhra Bank towards meeting the working capital requirements. It is interesting to note that the short term borrowing is also kept at low level, at just Rs.8.3Crs.
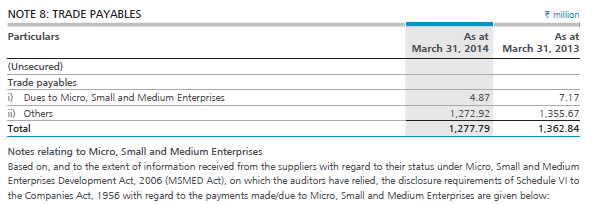
The next line item is Trade Payable (also called account payable) which is at Rs.127.7 Crs. These are obligations payable to vendors who supply to the company. The vendors could be raw material suppliers, utility companies providing services, stationary companies etc. Have a look at note 8 which gives the details:
M3-Ch6-Chart11
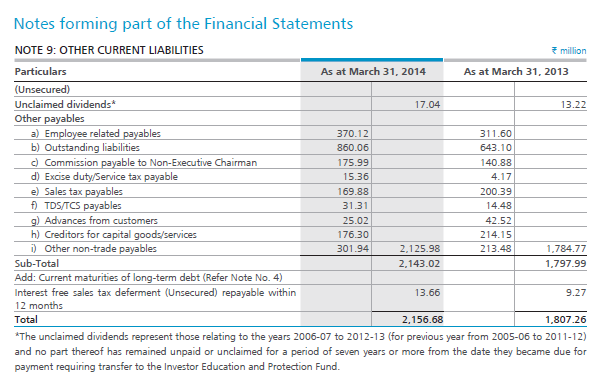
The next line item just says ‘Other current liabilities’ which stands at Rs.215.6 Crs. Usually ‘Other current Liabilities’ are obligations associated with the statutory requirements and obligations that are not directly related to the operations of the company. Here is note 9 associated with ‘Other current liabilities’:
M3-Ch6-Chart12
The last line item in current liabilities is the ‘Short term provisions’ which stands at Rs.281.8 Crs. Short term provisions is quite similar to long term provisions, both of which deals with setting aside funds for employee benefits such as gratuity, leave encashment, provident funds etc. Interestingly the note associated with ‘Short term Provisions’ and the ‘Long term provisions’ is the same. Have a look at the following:
M3-Ch6-Chart13
Since note 6 is detailing both long and short term provisions it runs into several pages, hence for this reason I will not represent an extract of it. For those who are curious to look into the same can refer to pages 80, 81, 82 and 83 in the FY14 Annual report for Amara Raja Batteries Limited.
However, from the user of a financial statement perspective all you need to know is that these line items (short and long term provisions) deal with the employee and related benefits. Please note, one should always look at the associated note to run through the details.
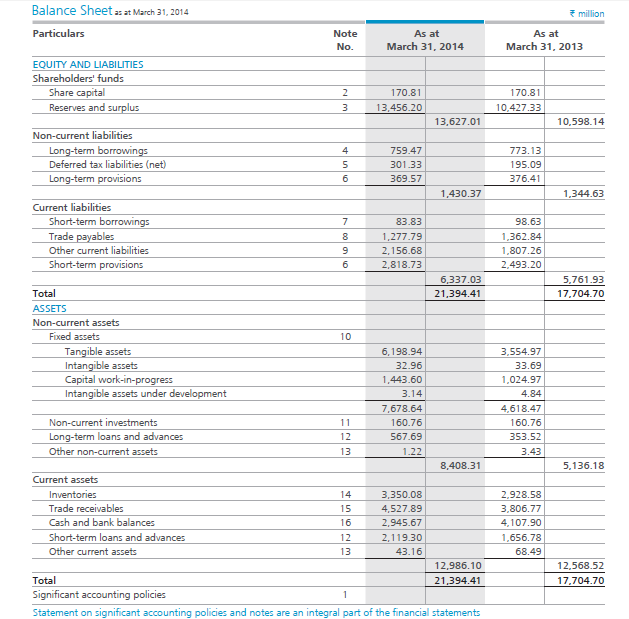
We have now looked through half of the balance sheet which is broadly classified as the Liabilities side of the Balance sheet. Let us relook at the balance sheet once again to get a perspective:
M3-Ch6-Chart14
Clearly,
Total Liability = Shareholders’ Funds + Non Current Liabilities + Current Liabilities
= 1362.7 + 143.03 +  633.7
Total Liability = Rs.2139.4 Crs

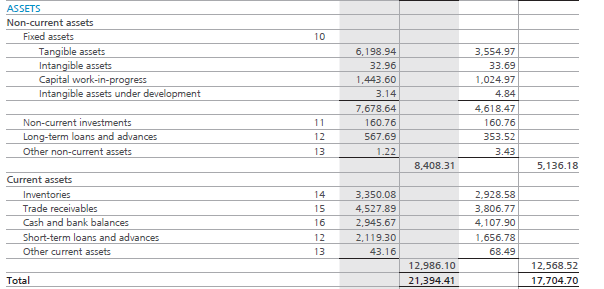
The Assets side of Balance Sheet
In the previous chapter we looked at the liability side of the balance sheet in detail. We will now proceed to understand the 2nd half of the balance sheet i.e the Asset side of the balance sheet. The Asset side shows us all the assets the company owns (in different forms) right from its inception. Assets in simple terms are the resources held by a company, which help in generating the revenues. Here is the snapshot of the Assets side of the balance sheet:
M3-Ch7-Chart1
As you can see the Asset side has two main sections i.e Non-current assets and Current assets. Both these sections have several line items (with associated notes) included within. We will look into each one of these line items.

Non-current assets (Fixed Assets)

Similar to what we learnt in the previous chapter, non-current assets talks about the assets that the company owns, the economic benefit of which is enjoyed over a long period (beyond 365 days). Remember an asset owned by a company is expected to give the company an economic benefit over its useful life.
If you notice within the non-current assets there is a subsection called “Fixed Assets” with many line items under it. Fixed assets are assets (both tangible and intangible) that the company owns which cannot be converted to cash easily or which cannot be liquidated easily. Typical examples of fixed assets are land, plant and machinery, vehicles, building etc. Intangible assets are also considered fixed assets because they benefit companies over a long period of time. If you see, all the line items within fixed assets have a common note, numbered 10, which we will explore in great detail shortly.
Here is the snapshot of fixed assets of Amara Raja Batteries Limited:
M3-Ch7-Chart2
The first line item ‘Tangible Assets’ is valued at Rs.619.8Crs. Tangible assets consists of assets which has a physical form. In other words these assets can be seen or touched. This usually includes plant and machinery, vehicles, buildings, fixtures etc.
Likewise the next line item reports the value of Intangible assets valued at Rs.3.2 Crs. Intangible assets are assets which have an economic value, but do not have a physical nature. This usually includes patents, copyrights, trademarks, designs etc.
Remember when we discussed the P&L statement we discussed depreciation. Depreciation is a way of spreading the cost of acquiring the asset over its useful life. The value of the assets deplete over time, as the assets lose their productive capacity due to obsolescence and physical wear and tear. This value is called the Depreciation expense, which is shown in the Profit and Loss account and the Balance Sheet.
All the assets should be depreciated over its useful life. Keeping this in perspective, when the company acquires an asset it is called the ‘Gross Block’. Depreciation should be deducted from the Gross block, after which we can arrive at the ‘Net Block’.
Net Block = Gross Block –Accumulated Depreciation
Note, the term ‘Accumulated’ is used to indicate all the depreciation value since the incorporation of the company.
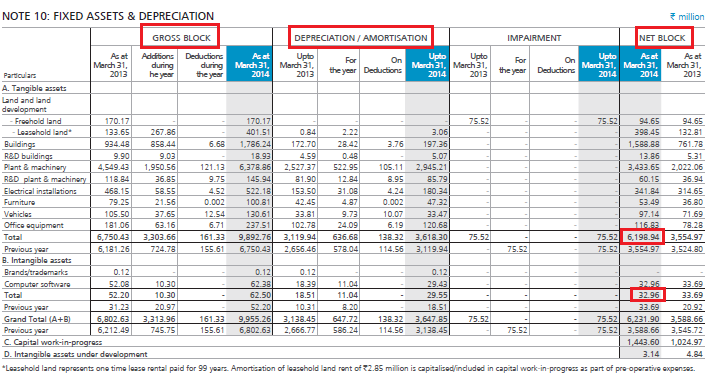
When we read tangible assets at Rs.619.8 Crs and Intangible assets at Rs.3.2 Crs, do remember the company is reporting its Net block, which is Net of Accumulated depreciation. Have a look at the Note 10, which is associated with fixed assets.
M3-Ch7-Chart3
At the top of the note you can see the Gross Block, Depreciation/amortization, and Net block being highlighted. I have also highlighted two net block numbers which tallies with what was mentioned in the balance sheet.
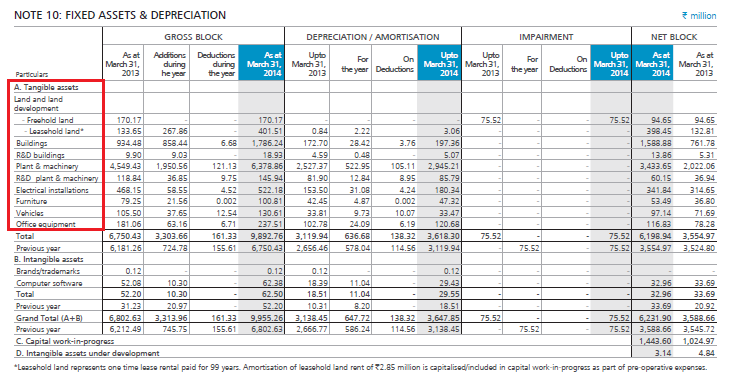
Let us look at a few more interesting aspects on this note. Notice under Tangible assets you can see the list of all the assets the company owns.
M3-Ch7-Chart4
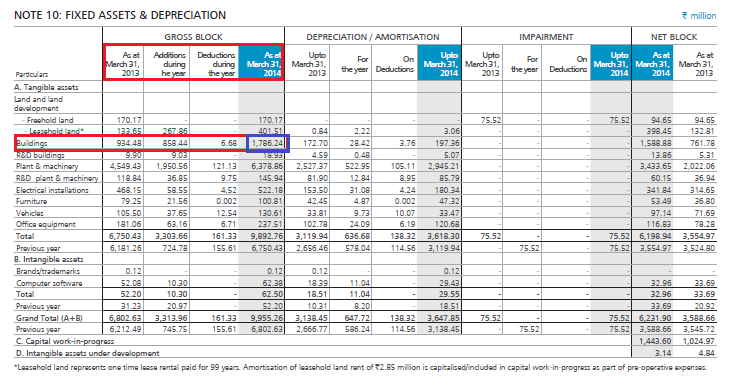
For example, the company has listed ‘Buildings’ as one of its tangible asset. I have highlighted this part:-
M3-Ch7-Chart5
As of 31st March 2013 (FY13) ARBL reported the value of the building at Rs.93.4 Crs. During the FY14 the company added Rs.85.8Crs worth of building, this amount is classified as ‘additions during the year’. Further they also wound up 0.668 Crs worth of building; this amount is classified as ‘deductions during the year’. Hence the current year value of the building would be:
Previous year’s value of building + addition during this year – deduction during the year
93.4 + 85.8 – 0.668
= 178.5Crs
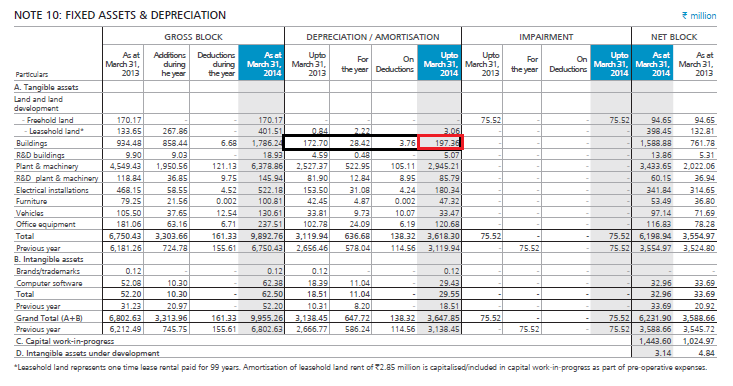
You can notice this number being highlighted in blue in the above image. Do remember this is the gross block of the building. From the gross block one needs to deduct the accumulated depreciation to arrive at the ‘Net Block’. In the snapshot below, I have highlighted the depreciation section belonging to the ‘Building’.
M3-Ch7-Chart6
As of 31st March 2013 (FY13) ARBL has depreciated Rs.17.2 Crs, to which they need to add Rs.2.8 Crs belonging to the year FY14, adjust 0.376 Crs as the deduction for the year. Thus, the Total Depreciation for the year is:-
Previous year’s depreciation value + Current year’s depreciation – Deduction for the year
= 17.2 + 2.8 – 0.376
Total Depreciation= Rs.19.736 Crs. This is highlighted in red in the image above.
So, we have building gross block at Rs.178.6 Crs and depreciation at Rs.19.73 Crs which gives us a net block of Rs.158.8 Crs ( 178.6– 19.73). The same has been highlighted in the image below:
M3-Ch7-Chart7
The same exercise is carried out for all the other tangible and intangible assets to arrive at the Total Net block number.
The next two line items under the fixed assets are Capital work in progress (CWIP) and Intangible assets under development.
CWIP includes building under construction, machinery under assembly etc at the time of preparing the balance sheet. Hence it is aptly called the “Capital Work in Progress”. This amount is usually mentioned in the Net block section. CWIP is the work that is not yet complete but where a capital expenditure has already been incurred. As we can see, ARBL has Rs.144.3 Crs under CWIP. Once the construction process is done and the asset is put to use, the asset is moved to tangible assets (under fixed assets) from CWIP.
The last line item is ‘Intangible assets under development’. This is similar to CWIP but for intangible assets. The work in process could be patent filing, copyright filing, brand development etc. This is at a miniscule cost of 0.3 Crs for ARBL. All these costs are added to arrive at the total fixed cost of the company.

Non-current assets (Other line items)

Besides the fixed assets under the non-current assets, there are other line items as well. Here is a snapshot for the same:
M3-Ch7-Chart8
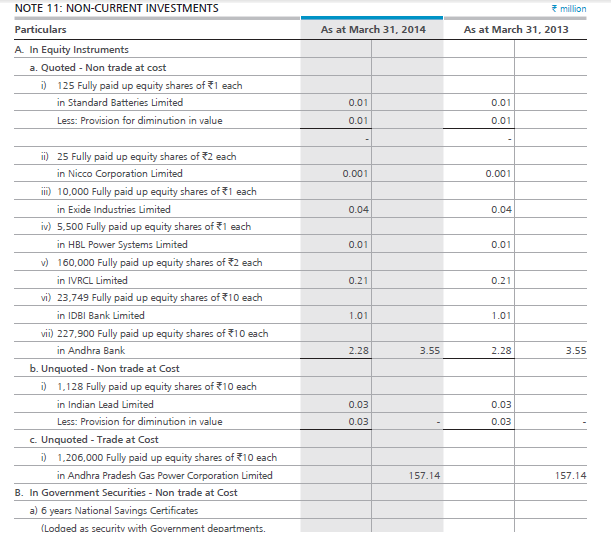
Non-current investments are investments made by ARBL with a long term perspective. This stands at Rs.16.07 Crs. The investment could be anything – buying listed equity shares, minority stake in other companies, debentures, mutual funds etc. Here is the partial (as I could not fit the entire image) snapshot of Note 11. This should give you a perspective.
M3-Ch7-Chart9
The next line item is long term loans and advances which stand at Rs.56.7Crs. These are loans and advances given out by the company to other group companies, employees, suppliers, vendors etc.
The last line item under the Non-current assets is ‘Other Non-current assets’ which is at Rs. 0.122 Crs. This includes other miscellaneous long term assets.

Current assets

Current assets are assets that can be easily converted to cash and the company foresees a situation of consuming these assets within 365 days. Current assets are the assets that a company uses to fund its day to day operations and ongoing expenses.
The most common current assets are cash and cash equivalents, inventories, receivables, short term loans and advances and sundry debtors.
Here is the snapshot of the current assets of ARBL:
M3-Ch7-Chart10
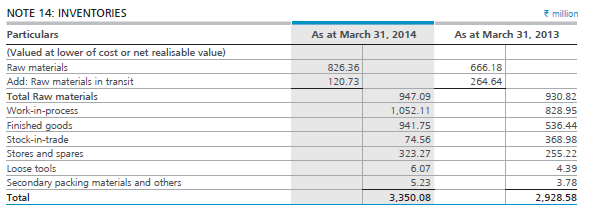
The first line item on the Current assets is Inventory which stands at Rs.335.0 Crs. Inventory includes all the finished goods manufactured by the company, raw materials in stock, goods that are manufactured incompletely etc. Inventories are goods at various stages of production and hence have not been sold. When any product is manufactured in a company it goes through various processes from raw material, to work in progress to a finished good. Snapshot of Note 14 associated with inventory of the company is as shown below:
M3-Ch7-Chart11
As you can see, a bulk of the inventory value comes from ‘Raw material’ and ‘Work-in- progress’.
The next line item is ‘Trade Receivables’ also referred to as ‘Accounts Receivables’. This represents the amount of money that the company is expected to receive from its distributors, customers and other related parties. The trade receivable for ARBL stands at Rs.452.7 Crs.
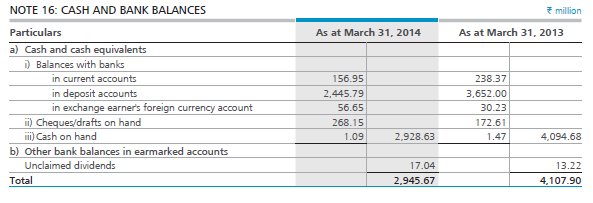
The next line item is the Cash and Cash equivalents, which are considered the most liquid assets found in the Balance sheet of any company. Cash comprises of cash on hand and cash on demand. Cash equivalents are short term, highly liquid investments which has a maturity date of less than three months from its acquisition date. This stands at Rs.294.5 Crs. Note 16 associated with Cash and bank balances is as shown below. As you can see the company has cash parked in various types of accounts.
M3-Ch7-Chart12
The next line item is short-term loans and advances, that the company has tendered and which is expected to be repaid back to the company within 365 days. It includes various items such as advances to suppliers, loans to customers, loans to employees, advance tax payments (income tax, wealth tax) etc. This stands at Rs.211.9 Crs. Following this, is the last line item on the Assets side and infact on the Balance sheet itself. This is the ‘Other current assets’ which are not considered important, hence termed ‘Other’. This stands at Rs.4.3 Crs.
To sum up, the Total Assets of the company would now be:-
Fixed Assets + Current Assets
= Rs.840.831 Crs + Rs.1298.61 Crs
= Rs. 2139.441 Crs, which is exactly equal to the liabilities of the company.
With this we have now run through the entire Assets side of the Balance sheet, and infact the whole of Balance sheet itself. Let us relook at the balance sheet in its entirety:
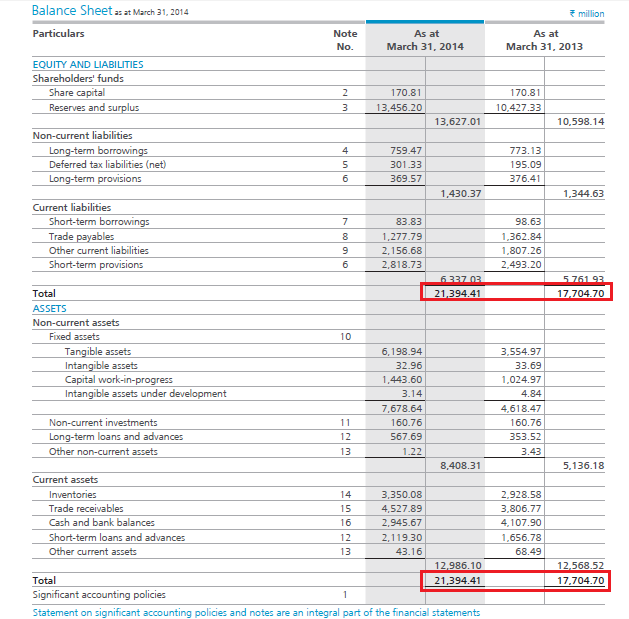
M3-Ch7-Chart13
As you can see in the above, the balance sheet equation holds true for ARBL’s balance sheet,
Asset = Shareholders’ Funds + Liabilities
Do remember, over the last few chapters we have only inspected the balance sheet and the P&L statements. However, we have not analyzed the data to infer if the numbers are good or bad. We will do the same when we look into the financial ratio analysis chapter.
In the next chapter, we will look into the last financial statement which is the cash flow statement. However, before we conclude this chapter we must look into the many ways the Balance sheet and the P&L statement are interconnected.

Connecting the P&L and Balance Sheet

Let us now focus on the Balance Sheet and the P&L statement and the multiple ways they are connected (or affect) to each other.
Have a look at the following image:
M3-Ch7-Chart14
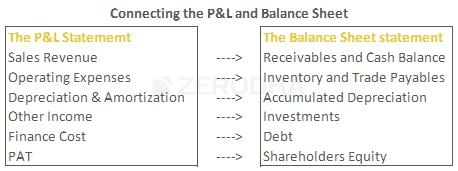
In the image above, on the left hand side we have the line items on a typical standard P&L statement. Corresponding to that on the right hand side we have some of the standard Balance Sheet items. From the previous chapters, you already know what each of these line items mean. However, we will now understand how the line items in the P&L and the Balance Sheet are connected to each other.
To begin with, consider the Revenue from Sales. When a company makes a sale it incurs expenses. For example if the company undertakes an advertisement campaign to spread awareness about its products, then naturally the company has to spend cash on the campaign. The money spent tends to decrease the cash balance. Also, if the company makes a sale on credit, the Receivables (Accounts Receivables) go higher.
Operating expenses includes purchase of raw material, finished goods and other similar expenses. When a company incurs these expenses, to manufacture goods two things happen. One, if the purchase is on credit (which invariably is) then the Trade payables (accounts payable) go higher. Two, the Inventory level also gets affected. Whether the inventory value is high or low, depends on how much time the company needs to sell its products.
When companies purchase Tangible assets or invest in Brand building exercises (Intangible assets) the company spreads the purchase value of the asset over the economic useful life of the asset. This tends to increase the depreciationmentioned in the Balance sheet. Do remember the Balance sheet is prepared on a flow basis, hence the Depreciation in balance sheet is accumulated year on year. Please note, Depreciation in Balance sheet is referred to as the Accumulated depreciation.
Other income includes monies received in the form of interest income, sale of subsidiary companies, rental income etc. Hence, when companies undertake investment activities, the other incomes tend to get affected.
As and when the company undertakes Debt (it could be short term or long term), the company obviously spends money towards financing the debt. The money that goes towards financing the debt is called the Finance Cost/Borrowing Cost. Hence, when debt increases the finance cost also increases and vice versa.
Finally, as you may recall the Profit after tax (PAT) adds to the surplus of the company which is a part of the Shareholders equity.